Printable Multiplication Chart 1–12
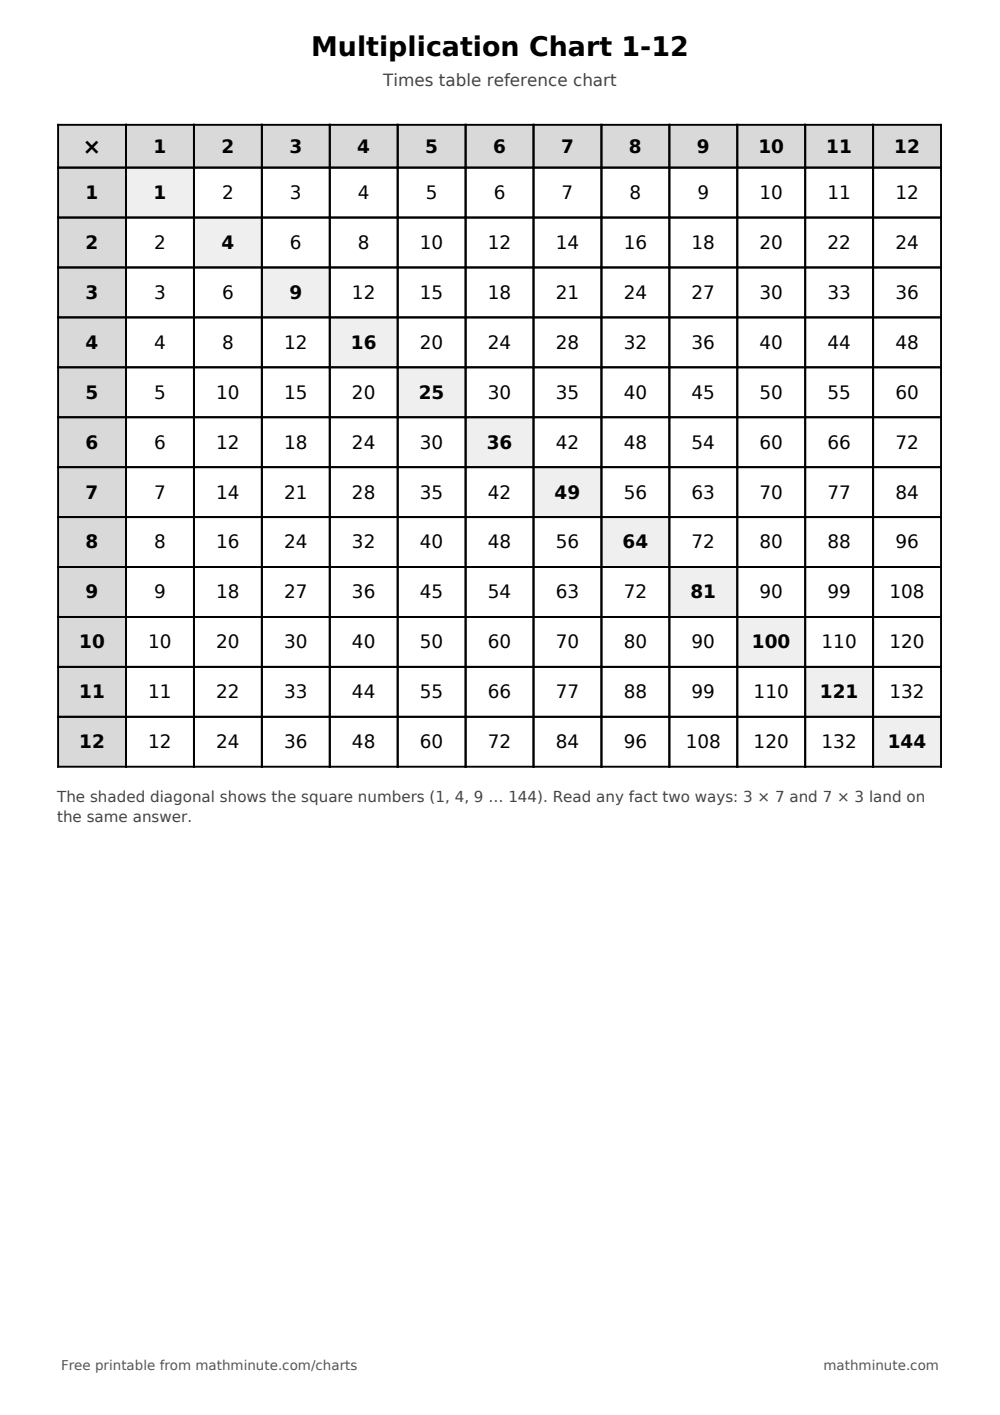
A clean, ink-friendly multiplication chart from 1 to 12 — every times table fact on one page. The shaded diagonal marks the square numbers (1, 4, 9 … 144), which make natural anchor points when learning the tables. Download the filled chart as a reference, or the blank version as a fill-in exercise that doubles as a self-test.
The Multiplication Chart at a Glance
| × | 1 | 2 | 3 | 4 | 5 | 6 | 7 | 8 | 9 | 10 | 11 | 12 |
|---|---|---|---|---|---|---|---|---|---|---|---|---|
| 1 | 1 | 2 | 3 | 4 | 5 | 6 | 7 | 8 | 9 | 10 | 11 | 12 |
| 2 | 2 | 4 | 6 | 8 | 10 | 12 | 14 | 16 | 18 | 20 | 22 | 24 |
| 3 | 3 | 6 | 9 | 12 | 15 | 18 | 21 | 24 | 27 | 30 | 33 | 36 |
| 4 | 4 | 8 | 12 | 16 | 20 | 24 | 28 | 32 | 36 | 40 | 44 | 48 |
| 5 | 5 | 10 | 15 | 20 | 25 | 30 | 35 | 40 | 45 | 50 | 55 | 60 |
| 6 | 6 | 12 | 18 | 24 | 30 | 36 | 42 | 48 | 54 | 60 | 66 | 72 |
| 7 | 7 | 14 | 21 | 28 | 35 | 42 | 49 | 56 | 63 | 70 | 77 | 84 |
| 8 | 8 | 16 | 24 | 32 | 40 | 48 | 56 | 64 | 72 | 80 | 88 | 96 |
| 9 | 9 | 18 | 27 | 36 | 45 | 54 | 63 | 72 | 81 | 90 | 99 | 108 |
| 10 | 10 | 20 | 30 | 40 | 50 | 60 | 70 | 80 | 90 | 100 | 110 | 120 |
| 11 | 11 | 22 | 33 | 44 | 55 | 66 | 77 | 88 | 99 | 110 | 121 | 132 |
| 12 | 12 | 24 | 36 | 48 | 60 | 72 | 84 | 96 | 108 | 120 | 132 | 144 |
How to Use a Multiplication Chart
To find a fact, run one finger down from the top number and another across from the side number — the answer sits where they meet. Because multiplication works in either order, 3 × 7 and 7 × 3 meet at the same 21, which quietly halves the number of facts to learn.
The chart works best as scaffolding, not a crutch: let students check answers against it during practice, then wean off it as recall gets faster. The blank chart is the natural next step — filling in an empty grid from memory (starting with the easy 1s, 2s, 5s, and 10s) shows exactly which facts still need work. When most of the grid comes easily, switch to the timed multiplication facts game to build speed.
Frequently Asked Questions
How do you read a multiplication chart?
Find one factor in the top row and the other in the left column, then follow the row and column until they meet — that cell is the product. For 6 × 8, go down from 8 and across from 6 to land on 48.
Why does the multiplication chart go up to 12?
Most curricula expect fluency through 12 × 12 because dozens appear constantly in real life — months, eggs, inches per foot — and knowing 11s and 12s makes fraction and time arithmetic faster.
Should kids use a multiplication chart or memorize the facts?
Both, in sequence. The chart builds understanding and supports early practice; memorization is the end goal. Use the chart for checking rather than looking up first, and retire it gradually as recall becomes automatic.