Printable Fraction–Decimal–Percent Chart
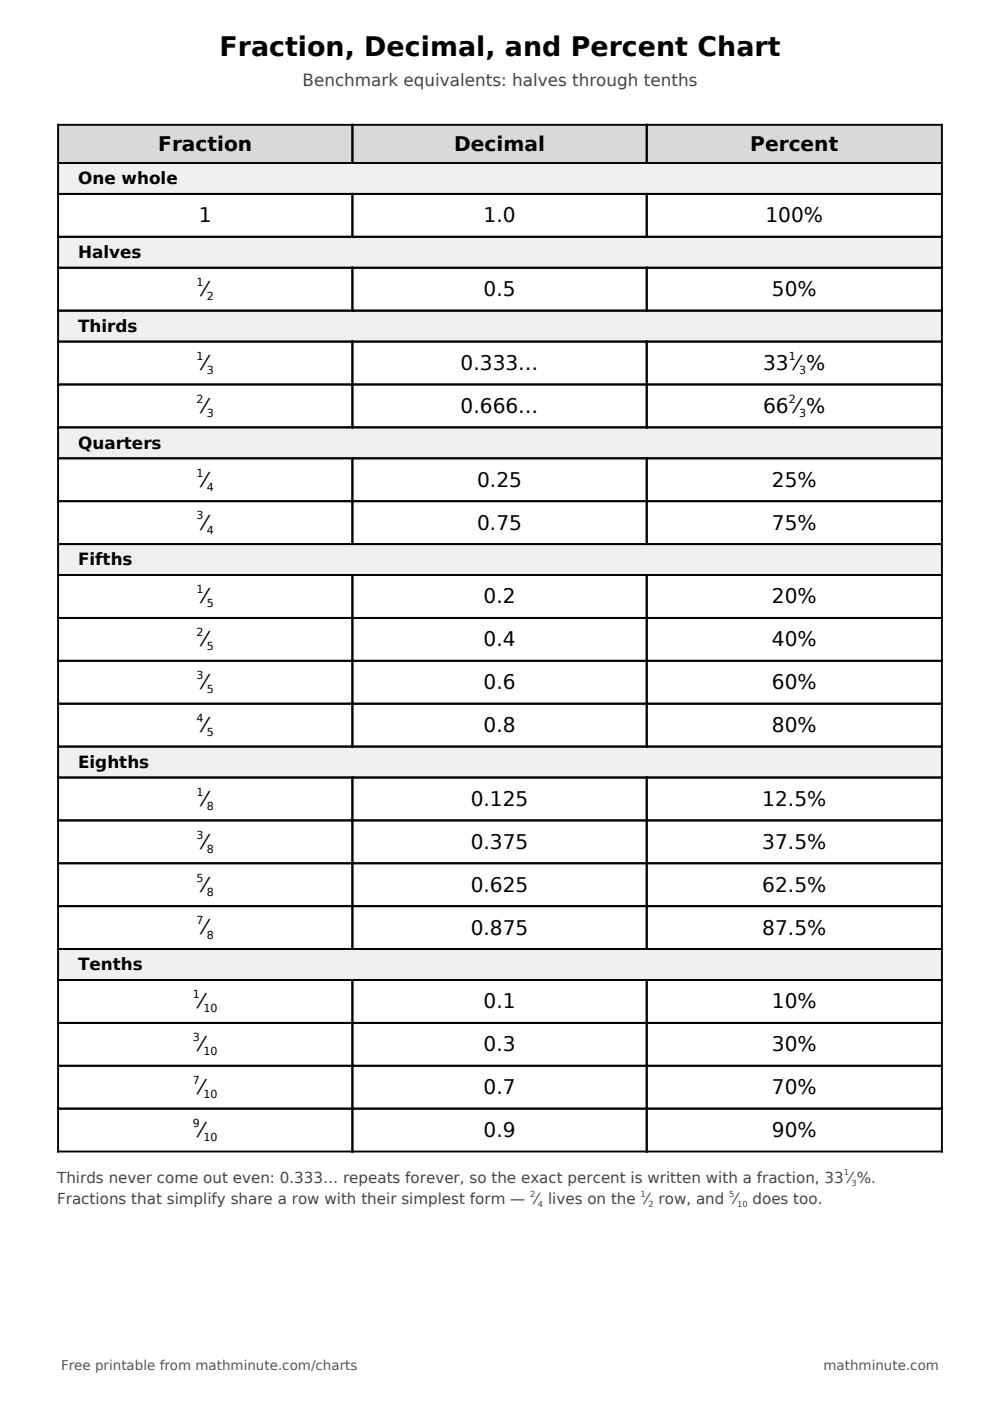
The benchmark equivalents every student ends up needing, on one page: halves, thirds, quarters, fifths, eighths, and tenths, each written three ways — fraction, decimal, percent. The chart makes the central idea visible: 3/8, 0.375, and 37.5% are not three numbers to learn separately. They are one number wearing three outfits.
How to Use the Equivalence Chart
Start with the rows worth memorizing outright: 1/2 = 0.5 = 50%, the quarters, and the tenths. Those benchmarks anchor everything else — 3/8 does not need its own memory slot once a student sees it sits halfway between 1/4 (25%) and 1/2 (50%). Reading across a row aloud ("one eighth, point one two five, twelve and a half percent") ties the three notations to a single quantity.
The chart also teaches by what it leaves out: 2/4 has no row because it lives on the 1/2 row — simplifying is not a rule to follow but a fact about numbers. For the conversion mechanics, work through the percentages guide, then drill until the benchmarks are automatic in the timed percentages game.
Frequently Asked Questions
Why do thirds have repeating decimals?
Because 3 does not divide evenly into any power of ten: 1 ÷ 3 gives 0.333… forever. That is why the chart writes the exact percent as 33⅓% rather than the rounded 33.3% — the fraction form is the only way to say it exactly.
Which equivalents should students memorize first?
Halves, quarters, and tenths: 1/2 = 50%, 1/4 = 25%, 3/4 = 75%, and 1/10 = 10%. They cover most real-world uses — money, test scores, discounts — and every other row can be reached from them by halving or combining.
How do you convert a fraction to a percent?
Divide the top by the bottom to get the decimal, then multiply by 100: 5/8 → 5 ÷ 8 = 0.625 → 62.5%. Going the other way, a percent is just a fraction with denominator 100: 62.5% is 62.5/100, which simplifies back to 5/8.